A Union B Intersect C Venn Diagram
News Co
Apr 06, 2025 · 5 min read
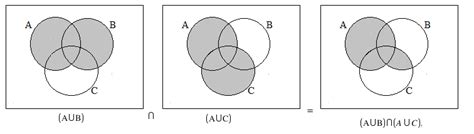
Table of Contents
A Union B Intersect C Venn Diagram: A Comprehensive Guide
Understanding Venn diagrams is crucial for anyone working with sets and logic. This comprehensive guide delves into the intricacies of the "A union B intersect C" Venn diagram, exploring its construction, interpretation, and applications across various fields. We'll break down the concept step-by-step, providing clear examples and practical applications to solidify your understanding.
Understanding the Basics: Sets and Set Operations
Before diving into the complexities of A union B intersect C, let's establish a strong foundation in set theory. A set is simply a collection of distinct objects or elements. These objects can be anything – numbers, letters, names, even other sets! For example:
- Set A: {1, 2, 3}
- Set B: {3, 4, 5}
- Set C: {5, 6, 7}
Now, let's explore the fundamental set operations:
1. Union (∪):
The union of two or more sets is a new set containing all the elements from the original sets, without duplication. For example, A ∪ B = {1, 2, 3, 4, 5}.
2. Intersection (∩):
The intersection of two or more sets is a new set containing only the elements that are common to all the original sets. For example, A ∩ B = {3}.
3. Complement ('):
The complement of a set contains all the elements that are not in the original set, usually considered within a universal set (the set of all possible elements). For example, if the universal set is {1, 2, 3, 4, 5, 6, 7}, then A' = {4, 5, 6, 7}.
Decoding the "A Union B Intersect C" Venn Diagram
The expression "A union B intersect C" represents a combination of union and intersection operations. Let's break it down:
-
B ∩ C: First, we find the intersection of sets B and C, identifying the elements common to both. Using our example sets, B ∩ C = {5}.
-
A ∪ (B ∩ C): Next, we take the union of set A and the result from the previous step (B ∩ C). This means combining all the elements from set A and the common elements of B and C, without repetition. In our example, A ∪ (B ∩ C) = {1, 2, 3, 5}.
Therefore, the "A union B intersect C" Venn diagram visually represents this final set: {1, 2, 3, 5}.
Constructing the Venn Diagram
A Venn diagram for three sets (A, B, and C) typically uses three overlapping circles. Each circle represents a set, and the overlapping regions represent the intersections of the sets.
Steps to Construct the A ∪ (B ∩ C) Venn Diagram:
-
Draw three overlapping circles: Label them A, B, and C.
-
Identify B ∩ C: Shade or highlight the region where circles B and C overlap. This represents the elements common to both B and C.
-
Include A: Now, shade or highlight the entire area of circle A, along with the area already shaded (B ∩ C). This combined area visually represents A ∪ (B ∩ C).
-
Label the regions: Clearly label each distinct region within the Venn diagram, indicating which elements belong to each section. For example, the region representing A only should be labeled "A only," the region representing (A ∩ B) but not C should be labeled "A ∩ B," and so on.
Visual Representation and Interpretation
The visual nature of a Venn diagram makes it an excellent tool for understanding set relationships. By looking at the shaded regions in the A ∪ (B ∩ C) diagram, we can immediately identify the elements belonging to the resulting set. This visual representation significantly aids in problem-solving involving sets and logic.
Practical Applications of A Union B Intersect C
The "A union B intersect C" concept, and its Venn diagram representation, finds applications in diverse fields:
1. Database Management:
Imagine a database with three tables: customers (A), products (B), and orders (C). A ∪ (B ∩ C) could represent all customers who have ordered products available in the database. The intersection (B ∩ C) identifies products that have been ordered, and the union with A retrieves all customers associated with those orders.
2. Market Research:
Consider a market survey investigating consumer preferences for three brands of soda (A, B, C). A ∪ (B ∩ C) could represent the total number of consumers who prefer at least one of the brands, specifically including those who prefer both brands B and C.
3. Logic and Reasoning:
In logic problems, Venn diagrams can help visualize and solve complex scenarios involving conditional statements and logical connectives (AND, OR). The A ∪ (B ∩ C) construct translates directly to logical expressions, allowing for a clearer understanding of the relationships between different propositions.
4. Probability and Statistics:
Venn diagrams can help illustrate probabilistic relationships between events. Understanding the regions within the diagram allows for calculating probabilities of different combinations of events occurring. For example, if A, B, and C represent different weather conditions, the diagram helps visualize the probability of at least one specific weather condition occurring (given certain independent probabilities).
Beyond the Basics: More Complex Scenarios
While we've focused on the basic A ∪ (B ∩ C) scenario, more complex combinations of sets and operations are possible. For example:
-
(A ∪ B) ∩ C: This represents the elements common to C and the union of A and B.
-
A ∩ (B ∪ C): This represents the elements common to A and the union of B and C.
Understanding these variations requires a strong grasp of the fundamental set operations and the order of operations (parentheses matter!). These more intricate scenarios can be visualized and solved using similar Venn diagram techniques, with slight modifications in how regions are highlighted and interpreted.
Conclusion: Mastering Venn Diagrams for Set Theory
The "A union B intersect C" Venn diagram is a powerful tool for understanding and visualizing relationships between sets. By mastering the underlying concepts of set theory, constructing and interpreting Venn diagrams becomes straightforward. The applications of this knowledge extend across various disciplines, from database management to market research and probability. Through consistent practice and application, you can confidently utilize Venn diagrams to solve complex problems and represent intricate relationships between sets. Remember to carefully consider the order of operations when working with multiple set operations to ensure accurate results. The ability to visualize these relationships using Venn diagrams is a crucial skill for anyone working with data, logic, and probability.
Latest Posts
Related Post
Thank you for visiting our website which covers about A Union B Intersect C Venn Diagram . We hope the information provided has been useful to you. Feel free to contact us if you have any questions or need further assistance. See you next time and don't miss to bookmark.