Fibonacci Of Highest To Lowest Low Formula
News Co
Apr 06, 2025 · 6 min read
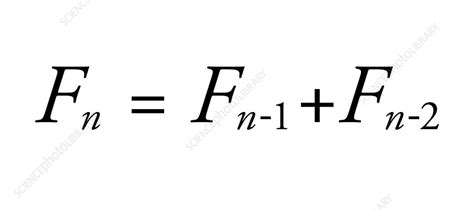
Table of Contents
Fibonacci: Decoding the Highest to Lowest Low Formula
The Fibonacci sequence, a seemingly simple series of numbers (0, 1, 1, 2, 3, 5, 8, 13, and so on, where each number is the sum of the two preceding ones), holds a profound influence across various fields, from mathematics and computer science to nature and, most pertinently for this discussion, finance. While the sequence itself is straightforward, its application in identifying potential support and resistance levels in financial markets, particularly using the "highest to lowest low" approach, requires a nuanced understanding. This article delves deep into this technique, exploring its mechanics, practical applications, and limitations.
Understanding the Fibonacci Sequence in Financial Markets
The magic of Fibonacci in finance stems from its appearance in naturally occurring patterns. This "golden ratio," approximately 1.618, derived from the sequence, is observed in the spiral arrangement of leaves on a stem, the shell of a nautilus, and even the proportions of the human body. Financial analysts believe these ratios also manifest in market price movements, with traders frequently employing Fibonacci retracement and extension tools to anticipate potential reversals or continuations of trends.
Fibonacci Retracement: Identifying Support and Resistance
Fibonacci retracement levels are calculated by dividing the difference between a significant high and a significant low by various Fibonacci ratios (23.6%, 38.2%, 50%, 61.8%, 78.6%, and 100%). These ratios are then applied to the original price range to determine potential support and resistance levels where price action might pause or reverse.
For example:
If a stock price rises from $50 to $100, and then begins to decline, the Fibonacci retracement levels would be calculated as follows:
-
100 - 50 = 50 (Price difference)
-
23.6% retracement: 50 * 0.236 = $11.80 (Retracement level: $100 - $11.80 = $88.20)
-
38.2% retracement: 50 * 0.382 = $19.10 (Retracement level: $100 - $19.10 = $80.90)
-
50% retracement: 50 * 0.50 = $25.00 (Retracement level: $100 - $25.00 = $75.00)
-
61.8% retracement: 50 * 0.618 = $30.90 (Retracement level: $100 - $30.90 = $69.10)
-
78.6% retracement: 50 * 0.786 = $39.30 (Retracement level: $100 - $39.30 = $60.70)
These calculated levels represent potential areas where buyers might step in to support the price (during a decline) or where sellers might exert pressure (during a rally). The 61.8% retracement level, often called the "golden ratio," is frequently considered the most significant.
Highest to Lowest Low: A Specific Fibonacci Application
The "highest to lowest low" method uses Fibonacci retracement but focuses on identifying potential support levels by connecting the highest high and the lowest low within a specific trend. This differs from standard retracement, which typically uses the most recent swing high and swing low.
Practical Implementation: Step-by-Step Guide
-
Identify a Defined Trend: This method is most effective when applied to a clear uptrend or downtrend. Look for a series of higher highs and higher lows (uptrend) or lower highs and lower lows (downtrend).
-
Locate the Highest High and Lowest Low: Within the identified trend, pinpoint the absolute highest high and the absolute lowest low.
-
Calculate the Price Difference: Subtract the lowest low from the highest high.
-
Apply Fibonacci Ratios: Multiply the price difference by the standard Fibonacci retracement ratios (23.6%, 38.2%, 61.8%, etc.).
-
Project Retracement Levels: Subtract the calculated values from the highest high. These resulting values represent potential support levels (in an uptrend) or resistance levels (in a downtrend).
-
Monitor Price Action: Observe how the price interacts with these projected levels. A bounce off a key Fibonacci level can confirm its significance.
Example: Applying the Highest to Lowest Low Technique
Let's assume a stock experienced the following price movements over a period:
- Highest High: $120
- Lowest Low: $60
Price Difference: $120 - $60 = $60
Applying Fibonacci ratios:
- 23.6% retracement: $60 * 0.236 = $14.16 (Retracement level: $120 - $14.16 = $105.84)
- 38.2% retracement: $60 * 0.382 = $22.92 (Retracement level: $120 - $22.92 = $97.08)
- 61.8% retracement: $60 * 0.618 = $37.08 (Retracement level: $120 - $37.08 = $82.92)
In this scenario, the price levels $105.84, $97.08, and $82.92 are potential support levels. If the price drops towards these levels and finds support, it might indicate a buying opportunity. Conversely, a break below these levels could signal a continuation of the downtrend.
Advantages and Disadvantages of the Highest to Lowest Low Approach
Advantages:
- Identifies Significant Support/Resistance: This method often pinpoints key levels that hold more weight than those calculated using recent swing highs and lows.
- Provides a Broader Perspective: By considering the entire trend, this approach offers a longer-term view of potential support and resistance areas.
- Complements Other Technical Indicators: It can be combined with other technical analysis tools to increase the accuracy of trading decisions.
Disadvantages:
- Sensitivity to Market Volatility: High market volatility can render these levels less reliable.
- Subjectivity in Trend Identification: Defining the precise beginning and end of a trend can be subjective.
- Not a Standalone Trading Strategy: It should not be used as the sole basis for making trading decisions. It works best in conjunction with other forms of analysis and risk management techniques.
Combining Fibonacci with Other Technical Indicators
Using Fibonacci levels in isolation is often less effective than combining them with other technical indicators. Consider integrating Fibonacci retracements with:
- Moving Averages: Confirmation of support or resistance at Fibonacci levels by moving average crossovers can strengthen trading signals.
- Relative Strength Index (RSI): An oversold RSI reading at a key Fibonacci support level can indicate a potential buying opportunity.
- MACD: A bullish divergence (price making lower lows while MACD makes higher lows) at a Fibonacci support level can be a powerful buy signal.
- Candlestick Patterns: Confirmation of support or resistance at Fibonacci levels by bullish or bearish candlestick patterns enhances their significance.
Risk Management and Practical Considerations
- Always Use Stop-Loss Orders: Protect your capital by setting stop-loss orders to limit potential losses.
- Position Sizing: Never risk more capital than you can afford to lose on any single trade.
- Backtesting: Test your strategy on historical data to evaluate its effectiveness.
- Combine with Fundamental Analysis: Consider fundamental factors like company earnings and economic indicators to improve the accuracy of your trading decisions.
Conclusion: A Powerful Tool, But Not a Crystal Ball
The Fibonacci "highest to lowest low" method is a powerful tool for identifying potential support and resistance levels in financial markets. However, it's crucial to understand that it is not a foolproof prediction system. Market dynamics are complex, and numerous factors beyond Fibonacci ratios can influence price movements. By integrating this technique with other technical indicators, employing sound risk management strategies, and considering fundamental analysis, traders can increase their chances of making informed and profitable trading decisions. Remember always to practice responsible trading and never risk more capital than you're comfortable losing. The highest to lowest low Fibonacci approach offers valuable insight, but successful trading requires a holistic and adaptable approach.
Latest Posts
Latest Posts
-
Whats The Square Root Of 2500
Apr 08, 2025
-
How To Make A Improper Fraction Into A Proper Fraction
Apr 08, 2025
-
What Percent Of 20 Is 8
Apr 08, 2025
-
Find The Shortest Distance From The Point To The Plane
Apr 08, 2025
-
Measuring Angles Using A Protractor Worksheet
Apr 08, 2025
Related Post
Thank you for visiting our website which covers about Fibonacci Of Highest To Lowest Low Formula . We hope the information provided has been useful to you. Feel free to contact us if you have any questions or need further assistance. See you next time and don't miss to bookmark.