How To Find F Critical Value
News Co
Apr 07, 2025 · 7 min read
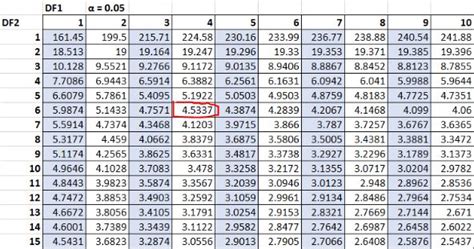
Table of Contents
How to Find the F Critical Value: A Comprehensive Guide
Finding the F critical value is a crucial step in many statistical analyses, particularly those involving ANOVA (Analysis of Variance) and regression analysis. Understanding how to locate this value is essential for determining statistical significance and drawing valid conclusions from your data. This comprehensive guide will walk you through various methods of finding the F critical value, explaining the underlying concepts and providing practical examples.
Understanding the F-Distribution and its Critical Value
The F-distribution is a probability distribution used to test the equality of variances of two or more populations. It's characterized by two degrees of freedom: the degrees of freedom for the numerator (df1) and the degrees of freedom for the denominator (df2). The F critical value is the value that separates the rejection region from the non-rejection region in an F-test. If your calculated F-statistic exceeds the F critical value, you reject the null hypothesis.
What does the F critical value represent? It represents the threshold at which the observed differences between groups (or variances) are considered statistically significant, unlikely to have occurred by random chance alone. The significance level (alpha), typically set at 0.05 (5%), influences the F critical value. A smaller alpha indicates a stricter criterion for significance, leading to a higher F critical value.
Methods for Finding the F Critical Value
There are several ways to determine the F critical value, each with its own advantages and disadvantages:
1. Using Statistical Tables
Traditionally, F critical values were obtained from statistical tables found in the appendices of statistics textbooks or specialized statistical handbooks. These tables typically present F critical values for various significance levels (alpha) and degrees of freedom (df1 and df2).
How to use an F-table:
- Identify your alpha level: This is usually 0.05 (5%), but it could be 0.01 (1%) or another level depending on your chosen significance level.
- Determine your degrees of freedom: The numerator degrees of freedom (df1) depend on the number of groups being compared minus 1 (k-1 in ANOVA) or the number of independent variables (in regression). The denominator degrees of freedom (df2) depend on the total number of observations minus the number of groups (N-k in ANOVA) or the number of observations minus the number of parameters estimated (in regression).
- Locate the intersection: Find the cell in the table where your alpha level, df1, and df2 intersect. The value at this intersection is your F critical value.
Limitations of F-tables:
- Limited degrees of freedom: Tables often have limited combinations of degrees of freedom, making it difficult to find the exact value for unusual scenarios.
- Inconvenient: Searching through tables can be time-consuming and less efficient compared to using statistical software.
2. Employing Statistical Software
Statistical software packages such as SPSS, R, SAS, STATA, and Python (with libraries like SciPy) provide functions to easily calculate the F critical value. This method offers greater precision and flexibility compared to using tables.
Example using R:
qf(1 - 0.05, df1 = 2, df2 = 15) #This calculates the F critical value for alpha = 0.05, df1 = 2, df2 = 15.
Example using Python (SciPy):
from scipy.stats import f
alpha = 0.05
df1 = 2
df2 = 15
f_critical = f.ppf(1 - alpha, df1, df2) #This calculates the F critical value
print(f_critical)
Advantages of using software:
- Precision: Software provides more accurate values, even for unusual combinations of degrees of freedom.
- Efficiency: It significantly reduces the time and effort required to obtain the F critical value.
- Flexibility: Most software can handle a wide range of alpha levels and degrees of freedom.
3. Using Online Calculators
Several websites provide free online F critical value calculators. These calculators typically require you to input the alpha level and degrees of freedom, and they instantly return the F critical value.
Advantages of using online calculators:
- Accessibility: They are readily available and easy to use.
- Convenience: They often provide a quick solution without requiring specialized software.
Disadvantages of using online calculators:
- Dependence on internet access: You need an internet connection to use them.
- Potential for errors: While generally reliable, there's always a slight risk of errors in the calculation algorithm.
Interpreting the F Critical Value in Hypothesis Testing
Once you've obtained the F critical value, you compare it to your calculated F-statistic from your ANOVA or regression analysis.
-
If your calculated F-statistic is greater than the F critical value: You reject the null hypothesis. This suggests that there is a statistically significant difference between the groups (in ANOVA) or that the model explains a significant portion of the variance in the dependent variable (in regression).
-
If your calculated F-statistic is less than or equal to the F critical value: You fail to reject the null hypothesis. This means that there is not enough evidence to conclude a statistically significant difference between the groups or a significant explanatory power of the model.
Understanding Degrees of Freedom (df) in F-tests
The degrees of freedom are crucial in determining the F critical value. They represent the number of independent pieces of information available to estimate the parameters of interest. A misunderstanding of degrees of freedom is a common source of errors in statistical analysis.
-
Numerator degrees of freedom (df1): This represents the degrees of freedom associated with the variance between groups (in ANOVA) or the variance explained by the model (in regression). It is typically calculated as the number of groups minus 1 (k-1) or the number of independent variables (p).
-
Denominator degrees of freedom (df2): This represents the degrees of freedom associated with the variance within groups (in ANOVA) or the variance unexplained by the model (in regression). It's often calculated as the total number of observations minus the number of groups (N-k) or the total number of observations minus the number of estimated parameters (N-p-1).
Choosing the Right Method for Finding the F Critical Value
The best method for obtaining the F critical value depends on your resources and needs:
-
For quick calculations with readily available degrees of freedom and a standard alpha level (0.05), using a statistical table might suffice. However, this approach is limited.
-
For greater precision, flexibility, and handling of unusual scenarios, using statistical software is highly recommended. The increased accuracy and efficiency outweigh the learning curve associated with using software.
-
Online calculators offer a convenient alternative when software isn't readily accessible. However, it is important to verify the reliability of the online resource.
Practical Examples
Let's illustrate with a couple of examples:
Example 1: ANOVA
Suppose you conducted a one-way ANOVA with 3 groups (k=3) and a total of 20 observations (N=20). Your alpha level is 0.05.
- df1 = k - 1 = 3 - 1 = 2
- df2 = N - k = 20 - 3 = 17
Using statistical software or an online calculator, you would find the F critical value for alpha = 0.05, df1 = 2, df2 = 17.
Example 2: Regression Analysis
Imagine you're performing a multiple linear regression with 2 independent variables (p=2) and 30 observations (N=30). Your alpha level is 0.01.
- df1 = p = 2
- df2 = N - p - 1 = 30 - 2 - 1 = 27
Using statistical software or an online calculator, you would find the F critical value for alpha = 0.01, df1 = 2, df2 = 27.
Conclusion
Finding the F critical value is a fundamental step in many statistical tests. While traditional tables offer a basic approach, employing statistical software or reputable online calculators provides greater accuracy, flexibility, and convenience. Understanding the underlying concepts of the F-distribution and degrees of freedom is crucial for proper interpretation of results and for drawing valid conclusions from your statistical analyses. By mastering these methods, you can confidently perform and interpret your F-tests, furthering your understanding and application of statistical analysis. Remember to always choose the method that best suits your resources and the specific requirements of your analysis. Accurate calculation and interpretation of the F critical value are essential for robust and reliable statistical inference.
Latest Posts
Related Post
Thank you for visiting our website which covers about How To Find F Critical Value . We hope the information provided has been useful to you. Feel free to contact us if you have any questions or need further assistance. See you next time and don't miss to bookmark.